Strategy visualization
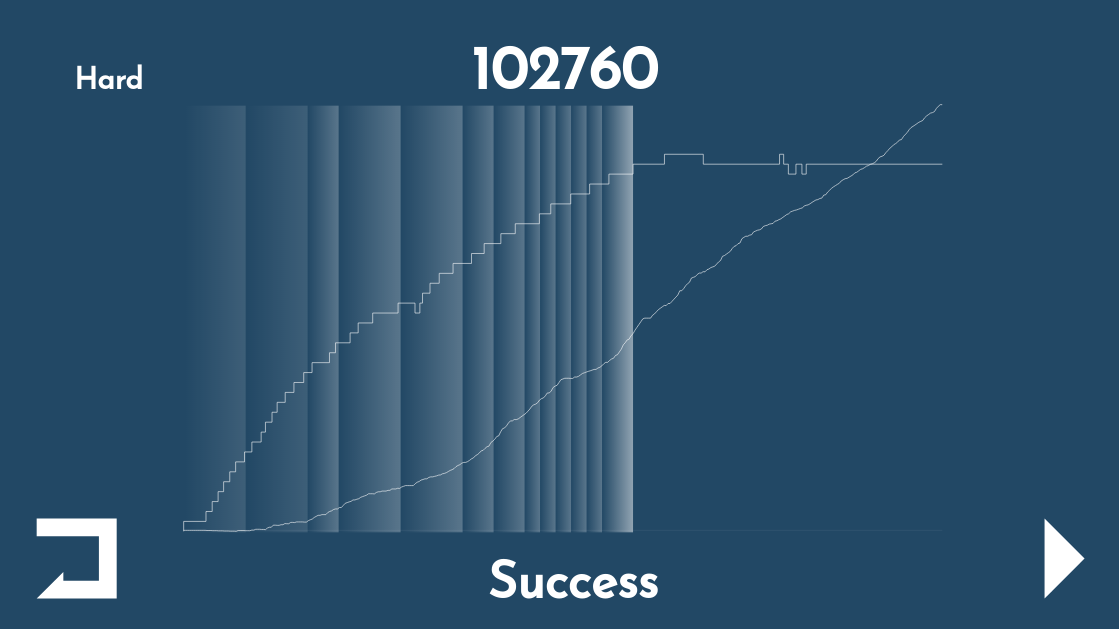
Here's a first installment of strategy visualization technique once you have finished the level. It's a composition of plots that let you see your gameplay as a whole. Right now the plots are unlabeled, which I will fix soon. The continuous line indicates your score as it increases against time. The staircase plot indicates the number of towers you build over time. The background gradients are waves of enemies. The width of each gradient tells how long it took to deploy, while the intensity of gradient tells the number of enemy units consisted in that wave.
I've also revamped the GUI architecture. There are no visual changes to the end user, but there is now a consistent SVG based framework for menus and screens.
Level 1 and 2 have been recalibrated to make them more interesting. Give them a try (especially the hard difficulty setting)
Files
Fold Wars Prototype
2D Tower Defense
More posts
- New Tower artworkFeb 21, 2018
- Where's my gold?Feb 20, 2018
- New Ship DesignFeb 17, 2018
- Level 4 - twice the resolution, block towerFeb 16, 2018
- Tower efficiency visualizationFeb 10, 2018
- Performance optimizationFeb 03, 2018
- Enemies marching in the lanesJan 28, 2018
- Today was spent in Heap ProfilerJan 25, 2018
- Tower plan with Walls, lot of waves, Difficulty levelsJan 24, 2018
Leave a comment
Log in with itch.io to leave a comment.